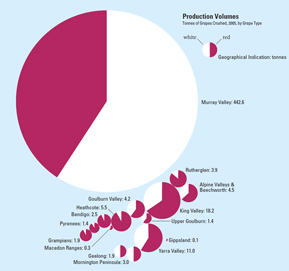
A clear, simple drawing of how many grapes are crushed by each of Victoria’s wine regions reveals some surprising truths about the wine-growing industry of Victoria. In the vW Maps cartogram, the circles representing the regions are sized according to the tonnes of grapes crushed in a typical year. These symbols are laid out in their correct geographical positions to make it easy for a reader familiar with the state to focus on the information contained in the diagram.
